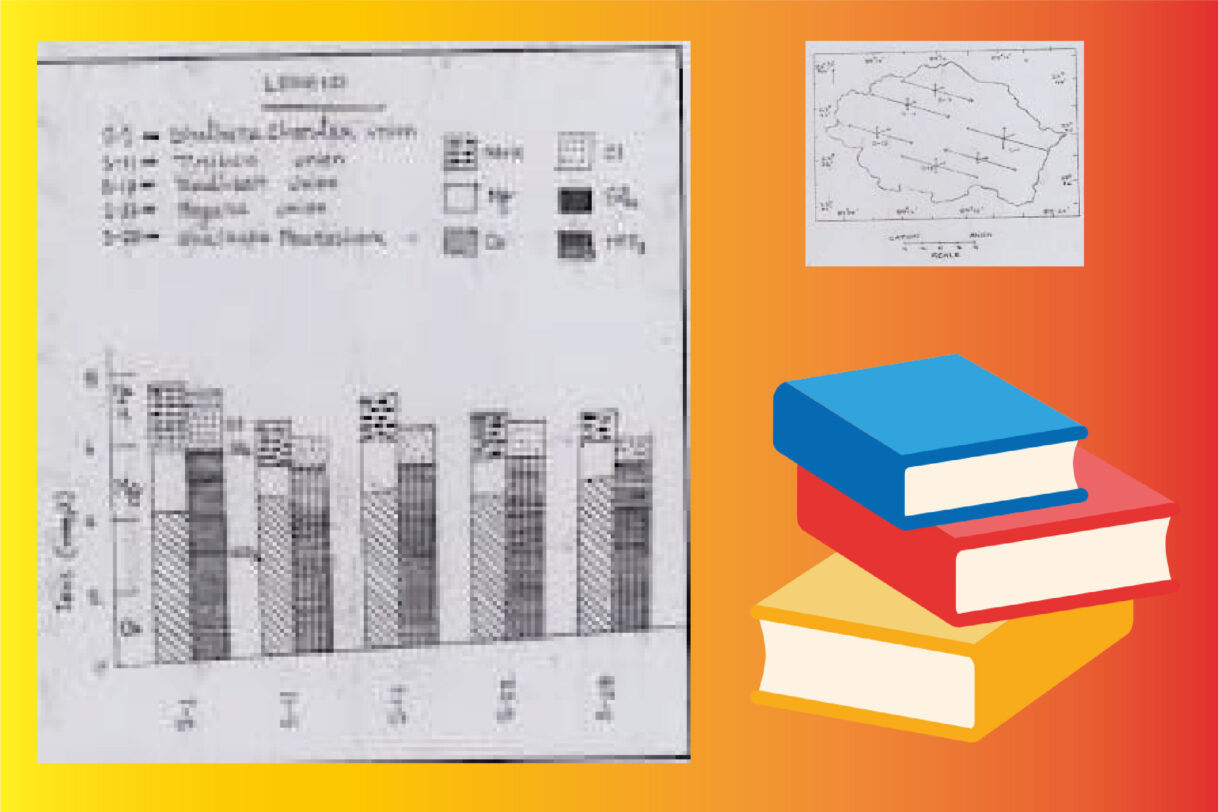
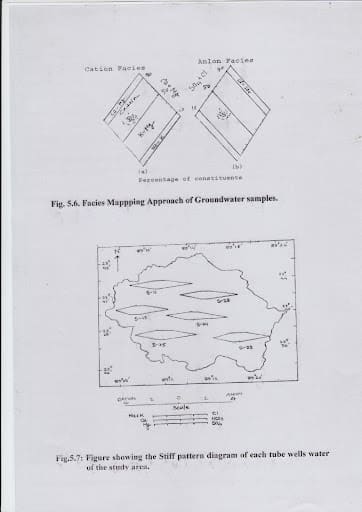
Stiff’s Pattern Diagram:
Purpose: A Stiff diagram, also known as a Stiff pattern or plot, is a graphical representation used in hydrogeology and geochemistry to visualize the major ion composition of a water sample. It allows for a rapid visual comparison between water from different sources.
Construction:
A polygonal shape is created using four or more parallel horizontal axes extending on either side of a vertical zero axis.
Cations (positively charged ions like Ca²⁺, Mg²⁺, Na⁺, K⁺) are plotted in milliequivalents per liter (meq/L) on the left side of the zero axis, one cation per horizontal axis.
Anions (negatively charged ions like HCO₃⁻, Cl⁻, SO₄²⁻) are plotted in meq/L on the right side of the zero axis, one anion per horizontal axis.
The plotted points are then connected by straight lines to form an irregular polygon.
Interpretation: The shape and size of the polygon provide a visual “fingerprint” of the water’s ionic balance. Similar shapes suggest similar water chemistry, potentially indicating a common source or geochemical processes. Differences in shape indicate variations in the dominant ions.
Collin’s Bar Graph:
Purpose: The term “Collin’s bar graph” in the context of hydrochemistry isn’t as universally standardized as Stiff or Maucha diagrams. However, it generally refers to a specific type of bar graph used to represent the concentration of major ions in a water sample.
Construction:
Typically, it involves a series of vertical or horizontal bars.
Each bar represents a specific major ion (e.g., Ca²⁺, Mg²⁺, Na⁺, K⁺, HCO₃⁻, Cl⁻, SO₄²⁻).
The length or height of each bar is proportional to the concentration of that ion, usually expressed in milliequivalents per liter (meq/L) or sometimes as a percentage of the total ions.
Cations are often grouped together on one side, and anions on the other, for easier comparison of the overall charge balance.
Interpretation: Collin’s bar graphs provide a straightforward way to see the absolute and relative concentrations of the major ions. They can be useful for comparing the dominant ions across different water samples or tracking changes in water chemistry over time or distance. The “Collin’s” aspect might refer to a specific layout or convention favored by a particular researcher or publication, but the fundamental principle is that of a bar graph representing ionic concentrations.
Mauch’s Radial Vector Diagram:
Purpose: Mauch’s radial vector diagram (sometimes referred to as a Maucha diagram or a circular diagram) is another graphical method used to represent the chemical composition of water. It offers a different visual perspective compared to Stiff diagrams.
Construction:
A circle is drawn, and radii are drawn from the center at specific angles (typically 60-degree intervals for six major ions).
The concentration of each major ion (usually expressed in milliequivalents per liter or as a percentage of total ions) is plotted along its corresponding radius, starting from the center of the circle.
The points plotted along each radius are then connected by straight lines, forming a polygonal shape within the circle.
Cations and anions are often plotted on opposite sides or in distinct segments of the circle.
Interpretation: The resulting polygonal shape provides a visual representation of the water’s chemical signature. Similar shapes indicate similar water types. Mauch diagrams can be particularly useful for visually identifying water mixing or the evolution of water chemistry along a flow path. The radial arrangement can sometimes make it easier to see the overall balance and relative proportions of different ion groups.


