For an undergraduate presentation, your goal is not to show everything you know—it’s to communicate your ideas clearly within the allotted time. A good presentation should be visually appealing, easy to follow, and focused on the key findings.
1. Know Your Audience
Before creating the slides, ask yourself:
- Who will attend? (Teachers, examiners, classmates)
- How much do they already know about the topic?
- How much time do you have? (Typically 10–15 minutes)
A common rule is about one slide per minute, so a 10-minute presentation usually needs 10–12 slides.
2. Standard Structure
| Slide | Content |
|---|---|
| 1 | Title |
| 2 | Background |
| 3 | Problem Statement |
| 4 | Objectives |
| 5 | Study Area |
| 6 | Methodology |
| 7–9 | Results |
| 10 | Discussion |
| 11 | Conclusion |
| 12 | Recommendations & Questions |
3. Title Slide
Include:
- Project title
- Your name
- Student ID
- Department
- University
- Supervisor
- Date
Keep it clean with a university logo.
4. Keep Slides Simple
Avoid paragraphs.
❌ Bad
Climate change is affecting many communities because of…
✅ Good
- Climate change is increasing flood risk.
- Agriculture is affected.
- Household livelihoods are changing.
5. Follow the 6×6 Rule
No more than:
- 6 bullet points
- 6 words per bullet (as a guideline)
Example:
Objectives
- Assess groundwater quality
- Analyze water level changes
- Evaluate irrigation suitability
- Recommend management strategies
6. Use High-Quality Figures
People remember visuals more than text.
Include:
- Maps
- Graphs
- Charts
- Flowcharts
- Photos
- Tables (only if simple)
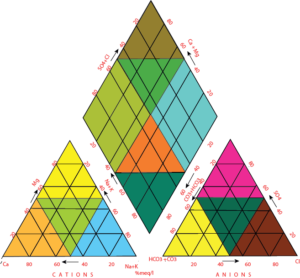
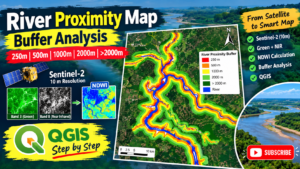
If using GIS or Remote Sensing, show your maps prominently.
7. Use Consistent Colors
Example palette:
- Dark blue
- White
- Light gray
Highlight important items with one accent color (e.g., orange or green).
Avoid using many bright colors.
8. Font Recommendations
Titles:
- 32–40 pt
Body:
- 20–28 pt
Use clear fonts such as:
- Calibri
- Aptos
- Arial
- Segoe UI
9. Results Section
Spend most of your time here.
For each result:
- Show the figure.
- Explain what it means.
- State why it matters.
Example:
Groundwater Quality
(Map on the left)
Key Findings
- Most samples meet drinking standards.
- Higher salinity near the coast.
- Irrigation suitability varies.
10. Avoid Overcrowding
❌ Don’t put:
- 300-word paragraphs
- Large tables
- Multiple charts on one slide
Aim for one main idea per slide.
11. Use Simple Animations
Recommended:
- Fade
- Appear
Avoid:
- Fly In
- Bounce
- Spin
- Flash
Animations should support the presentation, not distract from it.
12. Maintain a Consistent Layout
Use the same:
- Font
- Color scheme
- Header style
- Image alignment
- Margins
Consistency gives a professional appearance.
13. Highlight Key Numbers
Instead of:
The groundwater depth increased from 5.32 m to 7.84 m.
Use:
Groundwater Depth
5.32 m → 7.84 m
Increase: 2.52 m
14. Keep the Conclusion Focused
Do not repeat the entire presentation.
Summarize:
- Main findings
- Research contribution
- Practical implications
15. Finish Strong
Final slide:
Thank You
Questions?
Include your email if appropriate.
16. Presentation Design Tips
- Use plenty of white space.
- Align objects neatly.
- Use high-resolution images (300 dpi if possible).
- Ensure charts and maps are readable from the back of the room.
- Maintain consistent icon styles.
17. Common Mistakes to Avoid
- ❌ Reading directly from the slides.
- ❌ Using tiny fonts.
- ❌ Too many colors.
- ❌ Low-quality images.
- ❌ Long paragraphs.
- ❌ Too much text.
- ❌ Complex tables that are impossible to read quickly.
18. If Your Presentation Is a Research Thesis
A strong sequence is:
- Title
- Background
- Research Gap
- Problem Statement
- Objectives
- Study Area
- Conceptual Framework (if applicable)
- Methodology
- Results
- Discussion
- Conclusion
- Recommendations
- Limitations
- Future Research
- Thank You