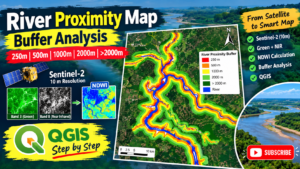
This content will show you step by step guidelines how I made the River Proximity Map using the QGIS and satellite images of sentinel 2 imagery.
Create a new project in qgis.
name the project with your own style. Create folder in your computer to keep the file after processing data.
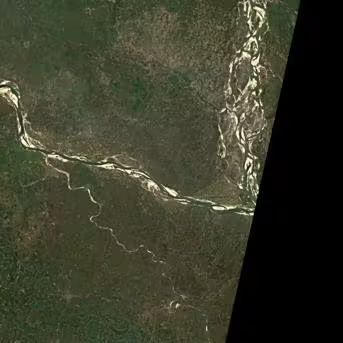
load the sentinel 2 imagery in the QGIS specially band B03 and Band B08.
Band B03 is Green band and Band B08 is near infrared band for sentinel 2.
Calculate NDWI Green- Near Infrared/ Green+near infrared
Before doing that repreject the CRS to UTM 46N for Bangladesh to calculate the area in hector later.
Now from the processing toolbox, polygonized Raster to Vector. Then select only river and save a selected feature to new geo package file.
This is the main file for the river proximity map.
add the location map and clip that location map from the river.
Now from the Raster calculator use the expression and DN>0 is the river only.
now come to the main calculation. Make the buffer of 0- 250m
250m – 500m
500m-1000m
1000m-2000m
To do buffer, use the butter tool and input file will be River file, with a 5 segment and add 250 m thick dissolve.
Now do the same process for the 500m, 1000m, 2000m.
Now make difference tool for the separation of buffer overlapping. Like 500m-250m difference is for the 500 line and indicates the value as intensity 4 as 250 line is for the intensity of 5.
After making all difference line resolve all.
This is the final river proximity map done.
Now You can design with the print layout option add the legend scale etc.