Piper Trilinear Diagram for Water Quality and Hydro-geochemical Analysis of groundwater is very essential tools even today’s ai evolution.
Piper triinear diagram step by step procedure for the hydrological geochemical analysis of groundwater.
Before going to the step we need to prepare for the major cation and anion in percentage value meq/l.
Data we need
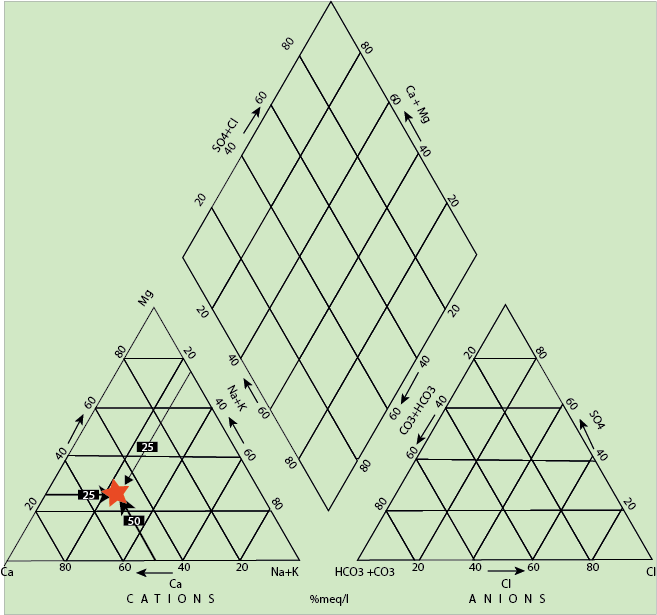
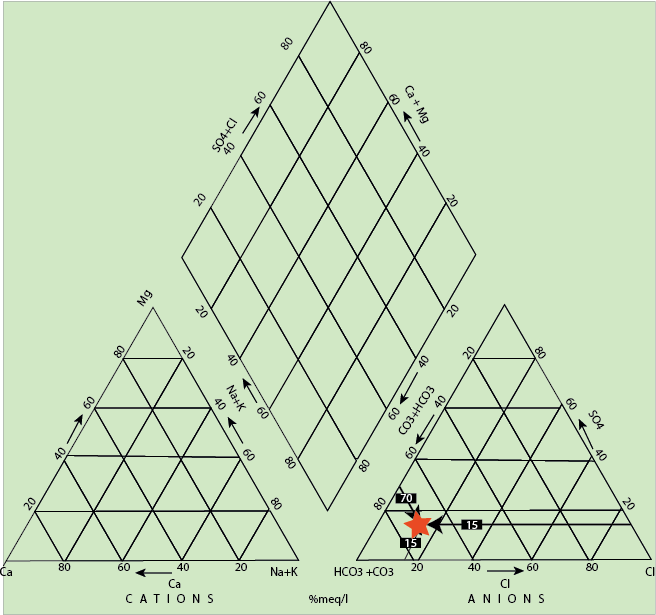
| Major Cation | (%meq/l) | Major Anions | (%meq/l) |
| Ca | 50 | HCO3 | 70 |
| Mg | 25 | SO4 | 15 |
| Na+K | 25 | Cl | 25 |
Procedure
Step 1:
Convert the Mg/l data for meq/l data for all the sample. Know how to convert the mg/l to meq/l. Convert this meq/l data to the percentage of %meq/l. See the data table above.
Link How to convert mg/l to meq/l
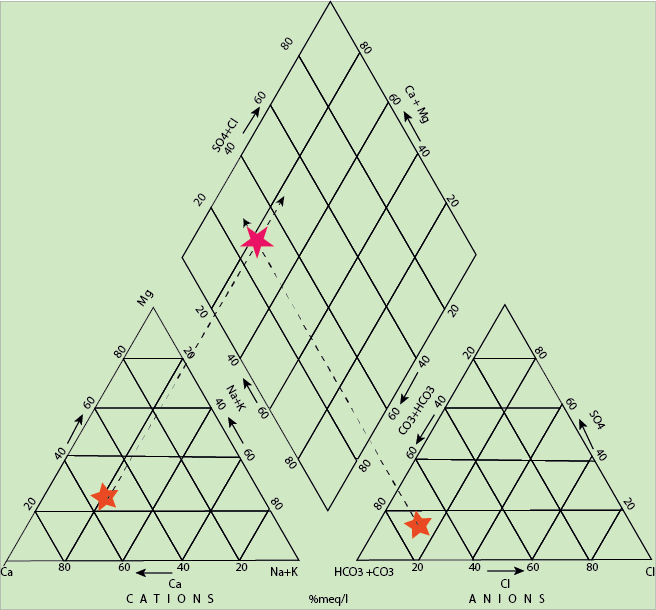
Now, plot the data for the cation as like as the fig below.
Now, plot the anion %meq/l data in the triangle shape of the piper trilinear diagram. Fig 2
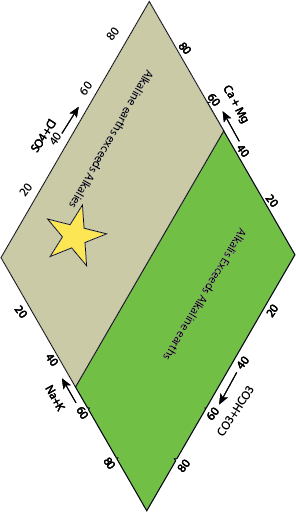
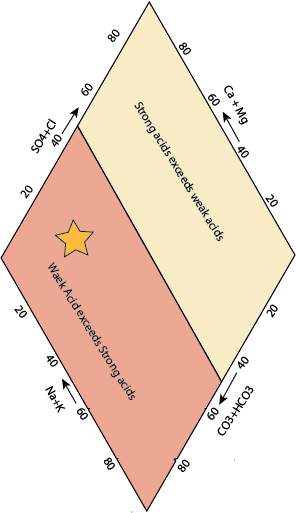
Plot the data for the Diamond area.